Physics Today, volume 57, Number 9, page 24, September 2004
New Experiments Highlight Universal Behavior in Copper Oxide Superconductors
Similar patterns of spin fluctuations and charge
ordering in different compounds suggests that these features are intrinsic to
the cuprates.
Since 1986, when lanthanum barium copper
oxide (LBCO) was found to superconduct above 30 K, many other such high−critical−temperature
(high−Tc) superconductors have been found, all of them
copper oxides having layered structures. The superconductivity appears to arise
from the planes of copper and oxygen atoms common to these compounds.
The undoped parents of all high−Tc
superconductors have one valence electron per copper atom. The ground state is
an antiferromagnetic insulator, in which the spin of each electron is aligned
opposite that of its neighbors. Once the compound is sufficiently doped with
holes or electrons, it goes superconducting below Tc, and the
electrons move in coherent pairs throughout the sample. Just how the material
makes the transition between these very disparate states has been the subject
of intense study.
Of particular interest is the nature of
any spin or charge ordering, either in the fully superconducting state or in
the underdoped state. When the material is underdoped but above Tc,
it's in the so called pseudogap region, where the material is in some
intermediate state between antiferromagnetism and superconductivity. Do the
charges, for example, arrange themselves in some regular pattern? Is that
pattern stripelike, or more like a checkerboard? Probing the charge or spin
structure might elucidate the underlying order and perhaps answer whether
magnetic order competes with superconductivity or is essential to it.
The latest revelations about spin or charge
order have come largely from complementary types of experiments. Scanning
tunneling microscopy (STM) measures the static density of electrons, thereby
giving a satisfying visual image of how the charge is ordered. But it can only
see the surface. By contrast, neutron scattering is sensitive to the spins and
not the charge. It's a probe of the dynamical spin excitations throughout the
bulk of a sample.
Ideally one would like to apply both
methods to the same material. Such attempts have been largely stymied, however,
because some materials lend themselves more readily to one type of measurement
than to another. It's hard to tell whether the data reflect individual or
universal properties.
STM has primarily probed the surface
charge order in crystals of bismuth strontium calcium copper oxide (Bi2Sr2CaCu2O8+δ,
or BSCCO for short) because those crystals cleave so cleanly. Neutron
scattering studies have been done on yttrium barium copper oxide (YBa2Cu3O6+x,
or YBCO for short) and on lanthanum strontium copper oxide (La2−xSrxCuO4,
or LSCO), which one can grow in sufficiently large crystals. Neutron scattering
has been hard to do on BSCCO because of the small size of available single
crystals, and STM studies of YBCO have been thwarted by the lack of a clean
surface.
Broadened
perspectives
A spate of experiments reported in the
past six months has now enriched the picture regarding charge and spin order.
Some of the experiments were done on materials that had not previously been
available, and some used new or improved techniques. As a result, patterns
previously seen in one member of the copper oxide family are showing up in
other compounds, or under different conditions.
In the case of STM studies, evidence has
been accumulating in the past few years for a checkerboard−like pattern
of electronic modulation in BSCCO.1−3 The
most recent such evidence comes from an experiment done earlier this year4 that found charge order in the pseudogap region by
probing an underdoped sample above Tc. Last month, as seen on
the cover of this issue, another experiment revealed5
static checkerboard charge order in a very different cuprate, known as sodium−doped
calcium copper oxychloride (Ca2−xNaxCuO2Cl2,
or Na−CCOC). In both the new STM studies, the charge order was found
under conditions that suppress superconductivity.
As for neutron scattering experiments,
recent work has shown, contrary to naive expectations, that the energy
dependence of the magnetic excitations in superconducting YBCO is similar to
that of a member of the lanthanum copper oxide family (La1.875Ba0.125CuO4)
that is not superconducting but does have a stripelike arrangement of spins and
charges.6,7 Other experiments8,9
concur on the behavior of the spin excitations in copper oxide compounds,
although researchers disagree on the finer details.
The STM and neutron scattering experiments
have broadened our knowledge of high−Tc materials, but
it's not clear how their separate findings are related to one other. Only when
several different techniques are brought to bear on the same material will
researchers get some insight into how the spin and charge structures influence
one other.
Probing
the charge order
In STM, one scans a conducting tip over a
surface while modulating the tip−to−surface voltage. The instrument
measures the tunneling conductance—that is, the change in tunneling current
with voltage—as a function of position. Such conductance measurements map the
electronic density of states over the surface.
To bring out any periodic structures in
the charge density, researchers do a fast Fourier transform of their data. The output
is a set of peaks at wavevectors that correspond to repeating patterns in the
data.
Using this technique, researchers have
found regular patterns of electronic density of states in BSCCO under a variety
of conditions.
Several years ago Aharon Kapitulnik and
his group at
There's growing evidence that charge order
is present when superconductivity is weakened. In another experiment also done
in 2002, Davis and coworkers found a checkerboard modulation of electronic
density in slightly overdoped BSCCO near the core of a magnetic flux line—where
the superconductivity had been destroyed.1 The
charge modulations were characterized approximately by a wavevector equivalent
to four lattice spacings, or 4a0. (See Physics
Today, February 2002, page 14.)
This March, Ali Yazdani and his coworkers
at the
|
Figure 1.
Charge order in underdoped BSCCO above Tc, as determined by
scanning tunneling microscopy. (a) Conductance maps. Below the
peudogap energy, at a tip−to−surface bias of 12 mV, one can see a
pattern of charge order amid an inhomogenous background. Above it, at 41 mV,
one sees modulations due to atoms and a known lattice distortion. The field
of view is 45 nm by 19.5 nm. (b) Fourier transform of conductance map
reveals four points (one of which is labelled A) associated with atomic sites
and four points (Q) due to charge ordering. The copper− oxygen bonds
are oriented along the <0 , π> direction. (c) Wavevectors
at Q and at A show no change with bias voltage. (Adapted from ref.
4.) |
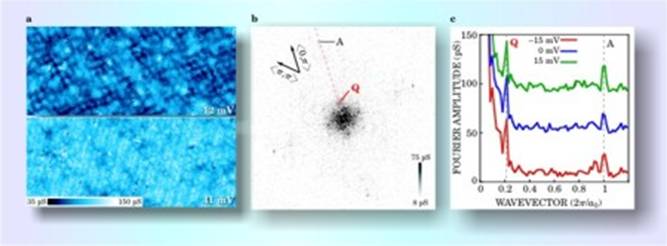
The experiment was a challenge, as it had
to be conducted at a much higher temperature than most STM measurements. The
group took data at 100 K—above the 80−K Tc of the
slightly underdoped sample.4 From the data they
collected, seen in figure 1, the Illinois−Tokyo experimenters zeroed in
on the four peaks arranged along the Cu−O directions at periodicities of
4.7a0. Yazdani and his group have shown that these peaks are
not consistent with quasiparticle interference but instead represent a static
modulation such as one might expect from charge ordering. The charge modulation
is seen only at energies within the pseudogap.
Sodium
oxychloride
BSCCO is doped by the addition of oxygen
atoms, which can distort the lattice and introduce some wavevectors that
complicate interpretation of STM data.
|
Figure 2 . Charge order in underdoped sodium oxychloride (a) Conductance map measured at 8
mV. Field of view is 20 by 20 nm. (b) Fast Fourier transform reveals
peaks at a wavevector of 1, attributed to the atomic lattice, as well as
peaks of unexplained origin at 3/4 and 1/4. Experimenters believe the
wavevector of 1/4 reflects a 4a0 × 4a0
checkerboard pattern of charge. Wavevectors are measured in units of 2π/a0.
(Adapted from ref. 5.) |

That collaboration studied samples of Na−CCOC
whose doping varied from from x = 0.08 to 0.12. Figure 2 shows
representative results taken with a bias voltage of 8 mV and at a temperature
of 100 mK. The experimenters found that the wavevectors are independent of
energy, up to 100 mV, and independent of the doping level.
To argue the relevance of their Na−CCOC
results to other copper oxides, Davis, Takagi, and colleagues point out that a
curve of the tunneling conductance versus tip bias is virtually the same for
underdoped BSCCO as it is for Na−CCOC. Philip Anderson and Nai−Phuan
Ong of Princeton University have recently calculated the shape of the
conductance curve.10
Despite its virtues, Na−CCOC is not
nearly as well characterized as the experimental warhorse, BSCCO. Such
characterization might help further establish how Na−CCOC relates to
other cuprates and the extent to which a measurement on its surface reflects
what's happening in the bulk.
Neutron
scattering
Neutrons can scatter from the atomic
nuclei or from the electronic spins on copper sites. A static but periodic arrangement
of spins is detected by peaks in the spectrum of elastically scattered
neutrons; dynamical spin fluctuations are registered as peaks in the inelastic
spectrum.
Neutron scattering off lanthanum copper
oxide, the antiferromagnetic parent of several of the high−Tc
cuprates, produces a diffraction peak at what's called the superlattice
wavevector in reciprocal space. It's centered at a wavevector of (1/2, 1/2) in
units of 2π/a0. When this compound is doped, the superlattice
peak splits into four peaks in reciprocal space, each displaced by a distance
δ along one of the orthogonal axes. This splitting reflects some
additional ordering that is apparently modulating the antiferromagnetic
correlations.
To understand how such peaks might arise,
consider just one simple model for spin modulation: the organization of the
copper oxide plane into linear stripes of segregated charges (holes) and spins
(copper atoms), each two atoms wide. If all such stripes extend in the same
direction, one would see two peaks on either side of the superlattice point.
Because the alternating pattern of spin reverses every 4 lattice units, the
modulated superlattice peaks would appear at (1/2 ± 1/8, 1/2) or (1/2, 1/2 ±
1/8), depending on the orientation of the stripe. Most cuprate crystals have
equal numbers of planes with orthogonal stripe direction, so four peaks appear.
The most prominent feature of neutron
scattering in YBCO is a strong resonance peak at the superlattice position
(1/2, 1/2). Some theorists think this resonance plays a large role in
superconductivity.
Experimental groups have reported similar
resonances in BSCCO11 and doped thallium barium
copper oxide.12 Until this June, no one expected
to see the resonance peak in stripe−ordered LBCO. That's when John
Tranquada and coworkers from Brookhaven National Laboratory and Tohoku
University published a paper reporting7 a
resonance in LBCO doped at x = 1/8. At that level, the superconductivity is
anomalously suppressed and the material is known to have stripe order.
Tranquada credits Tohoku's Masaki Fujita and Brookhaven's Genda Gu with growing
large samples of LBCO, which is notoriously hard to dope.
The study of LBCO was published at the
same time as a neutron scattering experiment on YBCO that looked at energies
well above the resonance.6 The two papers
together show that the energy dependence of the diffraction patterns in YBCO
and LBCO share some universal features. The data on YBCO was taken by
researchers led by Herbert Mook of Oak Ridge National Laboratory. Team members
hailed from
Hourglass
shape
|
Figure 3.
Superconducting YBCO. The neutron scattering diffraction patterns at three
energies follow the same trend as in a stripe−ordered compound, LBCO,
as seen in figure 4. The square pattern of peaks at 24 meV (c)
coalesce toward the center by 34 meV (b), then spread outward again by
66 meV (a). (Adapted from ref. 6.) |

Mook's and Tranquada's groups traced the
incommensurate peaks seen in YBCO and LBCO as a function of energy transferred
to the spin excitations. As shown in figures 3 and 4, the fourfold
incommensurate peaks seen at low energies moved toward the center in momentum
space as the energy increased, eventually merging into a single peak at (1/2,
1/2) at the resonance energy. As the energy was raised still further, the peaks
separated and moved out again. Plotting the wavevector, or momentum, versus
energy yields a dispersion curve that is shaped like an hourglass.13
|
Figure 4. Stripe−ordered LBCO. Neutron scattering
peaks seen at 6 meV (c) merge into a central peak by 55 meV (b)
and then diffuse outward by 105 meV (a), as in figure 3. These images
have been rotated to facilitate comparison because the two experiments used
different coordinate systems. (Adapted from ref. 7.) |

Disagreements remain over some of the
details of what's been observed. For example, Tranquada, Mook, and their
colleagues contend that the diffraction patterns seen above resonance in YBCO
and LBCO are squares that have been rotated by 45° compared to the orientation
seen below resonance. Bill Buyers of the National Research Council Canada at
Recently Gabriel Aeppli of University
College London and colleagues, working with a crystal of LSCO, have seen fully
two−dimensional excitations, which disperse inward toward the resonance
position.8
To explore whether the spin modulation is
two dimensional or one, a group led by Bernhard Keimer of the Max Planck Institute
for Solid State Research in
Tranquada and company did a simple
calculation to demonstrate that his group's data were consistent with what's
predicted by a model of spin ladders, one form of interaction among linearly
aligned spins. Subir Sachdev (
Barbara Goss Levi
References
1. J. E. Hoffman et al., Science 295, 466
(2002) [INSPEC].
2. J. E. Hoffman et al., Science 297,
1148 (2002) [MEDLINE].
3. C. Howald et al., Phys.
Rev. B 67, 014533 (2003).
4. M. Vershinin, S. Misra,
S. Ono, Y. Abe, Y. Ando, A. Yazdani, Science 303,
1995 (2004) .
5. T. Hanaguri, C. Lupien,
Y. Kohsaka, D.-H. Lee, M. Azuma, M. Takano, H. Takagi, J. C. Davis, Nature
(in press).
6. S. M. Hayden, H. A.
Mook, P. Dai, T. G. Perring, F. Dogan, Nature 429, 531
(2004) [SPIN].
7. J. M. Tranquada, H. Woo, T. G. Perring, H. Goka, G. D. Gu, G. Xu,
M. Fujita, K. Yamada, Nature 429, 534 (2004) [SPIN].
8. N. B. Christensen et al., http://www.arXiv.org/abs/cond-mat/0403439.
9. C. Stock et al., http://arXiv.org/abs/cond-mat/0408071. C. Stock et
al., Phys. Rev. B 69, 014502 (2004) [SPIN].
10. P. W. Anderson, N.-P. Ong, http://arXiv.org/abs/cond-mat/0405518.
11. H. F. Fong et al., Nature 398, 588 (1999) [INSPEC].
12. H. He et al., Science 295,
1045 (2002) [INSPEC].
13. M. R. Norman, C.
Pepin, Rep. Prog. Phys. 66, 1547 (2003) .
14. S. Palihès et al., http://arXiv.org/abs/cond-mat/0403609.
15. V. Hinkov et al., Nature
(in press).
© 2004 American Institute
of Physics